
Author: Imanizabayo Michel
Research Publication:
Assessing the Impact of Exports on Economic Growth:
A Co-integration and Error-Correction Case Study of Rwanda, 2000–2019
ABSTRACT
Export-led growth is frequently assigned a special role in theories of economic development, yet few studies isolate Rwanda and quantify how much of its output variation exports explain. Rwanda is landlocked, agriculture-dependent, and runs a persistent trade deficit, which makes the question policy-relevant.
To assess the impact of exports on Rwanda’s economic growth and to examine the extent and correlation of the relationship.
Quarterly GDP and exports of goods and services (current US dollars) for 2000Q1–2019Q4 (80 observations) were obtained from the National Institute of Statistics of Rwanda (NISR). Analysis in E-Views 7 used Augmented Dickey-Fuller (ADF) unit-root tests, Engle-Granger and Johansen co-integration procedures, an error-correction specification, a log-log ordinary least squares (OLS) long-run model, and Ramsey RESET and coefficient-correlation diagnostics.
Both series are integrated of order one, I(1): GDP (level t = −0.048, p = 0.995; first difference t = −11.479, p = 0.0001) and exports (level t = −2.882, p = 0.174; first difference t = −11.275, p = 0.0001). Both co-integration procedures indicate a long-run relationship at the 1%, 5%, and 10% levels. The long-run export elasticity of GDP is 0.878 (t = 29.48, p < 0.001; R² = 0.918). The Ramsey RESET test does not reject the specification (F = 2.12, p = 0.117). The error-correction term is negative and below unity in magnitude but statistically insignificant (−0.0049, p = 0.973), so the speed of adjustment is not reliably identified.
Exports are positively and significantly associated with GDP in the long run, consistent with the export-led growth hypothesis. Because the model is bivariate and exports are an accounting component of GDP, the elasticity should be read as a strong long-run association rather than a purely causal effect. Export promotion, agricultural support, industrialisation, and export diversification are recommended.
Keywords: exports; economic growth; GDP; co-integration; error correction model; Rwanda
JEL classification: F43, O11, O55, C22
1. INTRODUCTION
1.1 Background and context
Economic growth, an increase in national output or income over time, is a central policy concern worldwide and especially in Sub-Saharan Africa, including Rwanda (Kimberly, 2009). A sustainably expanding economy improves living standards and reduces poverty. Regional growth prospects are encouraging: the East African Community was projected to grow from 5.2% in 2017 to 5.8% in 2018 and 6.2% in 2019 (BNR, 2018). In the first quarter of 2020, Rwanda’s GDP at current market prices was estimated at Frw 2,452 billion, up from Frw 2,152 billion in the first quarter of 2019. Services contributed 48% of GDP, agriculture 25%, industry 19%, and taxes and subsidies on products the remaining 8% (NISR, 2020).
Rwanda is a densely populated, agriculture-dependent economy: 55.3% of the working-age population was engaged in agriculture in 2018 (NISR, 2018). Total export receipts rose 3.8% to USD 1,164.5 million in 2019, from USD 1,121.9 million in 2018, with volumes up 40.6%. That growth was driven by non-traditional exports (+10.1%) and re-exports (+22.4%), which offset a decline in traditional exports (−15.9%). Imports meanwhile grew 10.6%, driven by capital goods (+17.8%) linked to development projects and intermediate goods (+16%) tied to construction and manufacturing (BNR, 2020). Although exports have diversified, both traditional and non-traditional exports have underperformed relative to projections, and cross-border trade has been constrained by non-tariff barriers in the Democratic Republic of Congo and Burundi (NST1, 2017–2024).
As a landlocked country with limited natural resources, Rwanda has seen imports grow faster than exports in both value and volume, sustaining a trade deficit that, through the expenditure approach to GDP accounting, feeds directly into growth outcomes (NISR, 2020). In the first quarter of 2020, real GDP grew 3.6% year-on-year while exports of goods and services rose 19% and imports of goods and services rose 27% (NISR, 2020). Rwanda’s ambition to reach middle-income status rests partly on export promotion as a growth driver, yet growth has continued alongside a widening trade deficit. This tension motivates an empirical assessment of the exports–growth relationship.
While the broader literature establishes a link between exports and growth, few studies isolate Rwanda specifically, and fewer still quantify the magnitude of that relationship in a way that can directly inform trade-policy recommendations. Earlier Rwandan work has either combined exports and imports over a long historical window (Nyasulu, 2013, covering 1970–2010) or concentrated on a single commodity, as in the analysis of tea exports and their determinants by Uwimana et al. (2018). Cross-country reviews of the econometric evidence caution that findings vary with the country, period, and technique employed (Anwer & Sampath, 2011). A country-specific, time-series estimate based on quarterly data and modern co-integration methods therefore adds information that neither the cross-country nor the single-commodity studies can supply.
This study addresses that gap by estimating how much of the variation in Rwanda’s GDP is explained by exports over 2000–2019, testing whether the relationship is a genuine long-run equilibrium rather than a spurious correlation between trending series, and examining how quickly deviations from that equilibrium are corrected.
1.2 Objectives, research questions, and hypotheses
The general objective is to assess the impact of exports on the economic growth of Rwanda. The specific objectives are (i) to identify the impact of exports on economic growth, (ii) to examine the extent to which exports influence economic growth, and (iii) to assess the correlation between exports and economic growth. Correspondingly, the study addresses three research questions: (RQ1) What is the impact of exports on economic growth? (RQ2) To what extent do exports influence economic growth? (RQ3) What is the correlation between exports and economic growth? These translate into two competing hypotheses:
- H₀: Exports do not affect economic growth in Rwanda (β₁ = 0).
- H₁: Exports have a significant and positive effect on economic growth in Rwanda (β₁ > 0).
Understanding the exports–growth relationship matters because exports are a major source of employment and a driver of national growth. The findings offer policymakers evidence to inform trade policy, and give economists and researchers a country-specific estimate of how exports relate to growth, poverty reduction, job creation, foreign-exchange earnings, and the balance of payments. The study is bounded in time to quarterly data from 2000 to 2019, a period long enough to capture macroeconomic relationships while remaining reasonably current. It is bounded in domain to macroeconomic analysis rather than firm- or sector-level dynamics, and in space to the Rwandan economy.
1.3 Theoretical foundations
The study draws on four traditions in growth theory (for syntheses, see Rostow, 1990; Heijdra & van der Ploeg, 2006). Classical economists (Smith, 1776; Salvadori, 2003) explained growth through the interplay of labour, capital, land, and technology, mediated by class-based savings and investment behaviour, and emphasised complementary non-economic factors such as political stability, secure property rights, and effective institutions. The Keynesian tradition, formalised in the Harrod–Domar model (Harrod, 1939; Domar, 1946), models growth as driven by the equality of savings and investment under fixed prices and a single cost-minimising technique. Kaldor (1956) later emphasised entrepreneurial risk-taking and investment attitudes, rather than savings or population growth per se, as the true engine of growth.
Neoclassical growth theory, epitomised by the Solow–Swan model (Solow, 1956, 1957), attributes growth to labour, capital, and an exogenously determined level of technology, predicting convergence of similar economies to a common steady state (the Absolute Convergence Hypothesis), later qualified by the Conditional Convergence Hypothesis and by Ramsey’s endogenous-savings extension. Endogenous growth theory (Romer, 1990; Lucas, 1988) responds to the neoclassical model’s inability to explain sustained growth without exogenous technological change, treating innovation, human-capital accumulation, and financial intermediation as internally determined drivers of long-run growth.
Trade theory situates exports within this growth story (Markusen et al., 1995). International trade, the cross-border exchange of goods, services, and factors, is a long-standing driver of world GDP growth (Yuriy & Tadeusz, 2014), and the expenditure approach to national accounting explicitly includes net exports as a component of GDP (OECD, 2009). Trade balance, or net exports, is the value of exports less imports (Mankiw, 2009); in Rwanda’s national accounts exports are valued Free on Board and imports on a Cost, Insurance and Freight basis (NISR, 2019). Free trade is held to allocate resources efficiently across borders, delivering better-quality, lower-priced goods (Vijayasri, 2013). Growth itself depends on direct factors (human resources, natural resources, capital, and technology) and on indirect institutional and policy factors (Denison, 2015; Acemoglu, 2009). Exports specifically expand the markets available for domestic production and are theorised, and empirically found, to correlate positively with GDP (Awe, 2013; Gani & Clemes, 2015; Olawale Oyebanjo, 2017).
1.4 Empirical evidence
Cross-country evidence on the exports–growth relationship is broadly, though not universally, supportive of export-led growth. In Pakistan, Fatemah and Qayyum (2018) used co-integration and an error-correction framework (1971–2016) to show that exports, alongside labour, investment, and domestic credit, are significant long- and short-run drivers of growth. Aisha et al. (2017), using OLS on 1990–2012 data, likewise found a positive exports–growth relationship, though with a stronger effect running from growth to exports than the reverse. Agricultural exports have received particular attention: Faridi (2012) examined the contribution of agricultural exports to growth in Pakistan, and Yifru (2015) studied agricultural exports of coffee, oilseeds, and pulses in an East African setting. Both are relevant to an agriculture-dependent economy such as Rwanda’s.
Evidence from other settings is more nuanced. In Panama, Sayef and Mohamed (2017) applied Johansen co-integration and Granger causality (1980–2015) and found no direct long-run relationship between exports, imports, and growth, but did detect bidirectional causality from both imports and exports to growth. Aicha (2005), studying Morocco (1980–2013) with a vector error correction model, found co-integration among the variables and short-run bidirectional causality between growth and imports, alongside no significant short-run causality running from exports to growth. Ruba et al. (2014), examining Jordan (2000–2012) with Granger causality, found causality running from growth to exports rather than the reverse, while Dodaro (1993), using linear regression on 1967–1986 data for a panel of least-developed countries, found only fragile support for either direction of causality. Awokuse (2007) examined causality between exports, imports, and growth in transition economies, and Mogoe and Mongale (2014) assessed the impact of exports and imports on growth in South Africa.
Regional and historical studies offer further perspective. Karolina and Södersten (2002) found that Asian economies’ rapid post-1970 growth in GDP per capita was export-biased, driven by specialisation in favourably priced sectors, in contrast with slower Western growth over the same period. Vanek (1971) theoretically linked the terms of trade to growth, showing that a decline in the international price of capital goods raises demand for capital and, in turn, the equilibrium capital–labour ratio of small open economies. Ram (1987), pooling time-series and cross-section data across a broad panel of developing countries, found export growth to be positively associated with output growth in the majority of cases, particularly where exports represented a relatively large share of GDP. Krueger (2010) traced the post-war shift from import substitution to outward-oriented trade regimes and argued that countries that liberalised trade and actively promoted exports generally recorded faster and more sustained growth, while cautioning that the benefits depended heavily on complementary domestic policy and institutional capacity. For Sub-Saharan Africa, Ogbokor (2017) emphasised export diversification as a strategy for post-crisis growth, and Kumar (2016) reviewed the determinants of export performance in developing countries.
Collectively, this literature establishes a plausible, though not mechanically deterministic, positive relationship between exports and growth, with the direction of causality varying across countries, periods, and estimation techniques. This variation motivates a country-specific empirical test for Rwanda.
1.5 Conceptual framework
The study models exports as the independent variable and GDP as the dependent variable. GDP is the standard indicator of a nation’s economic performance and the International Monetary Fund’s preferred growth measure (Tjukanov, 2011), and prior studies commonly adopt exports as an explanatory variable for growth (Awokuse, 2007; Mogoe & Mongale, 2014). Exports are one of three principal dimensions of international trade, alongside imports and trade openness, and the present study isolates the specific contribution of exports to GDP. Figure 1 summarises the framework, including the channels through which exports may raise output and the controls that the bivariate design omits.
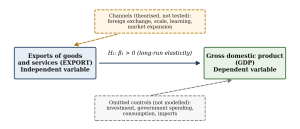
Figure 1. Conceptual framework of the study. Solid arrow: relationship tested; dashed elements: theorised channels and omitted controls.
The remainder of the paper follows the IMRAD structure. Section 2 describes the data and methods, Section 3 reports the results, and Section 4 discusses the findings, their policy implications, and the study’s limitations. Section 5 concludes and offers recommendations.
2. METHODS
2.1 Research design
The study uses a quantitative, time-series research design, which is appropriate for analysing socio-economic relationships across repeated observations of the same variables over time (Bryman & Bell, 2007; Bhattacherjee, 2012). It relies entirely on secondary data. No human participants were involved, and all data are drawn from official, publicly available national statistics, so no ethical clearance issues arise.
2.2 Data and variables
The data were obtained from the National Institute of Statistics of Rwanda (NISR). They comprise quarterly GDP and quarterly exports of goods and services, both measured in current US dollars, spanning 2000Q1 to 2019Q4, which yields 80 observations. Table 1 defines the variables and their roles.
Table 1. Variables, measurement, and source
| Variable | Definition | Role | Source |
| GDP | Quarterly gross domestic product, current US dollars | Dependent | NISR |
| EXPORT | Quarterly exports of goods and services, current US dollars (valued Free on Board) | Independent | NISR |
| LOG(GDP), LOG(EXPORT) | Natural logarithms of the above, used in the long-run model | Transformed | Author’s calculation |
Note. Sample: 2000Q1–2019Q4, n = 80.
2.3 Model specification
Consistent with prior OLS-based studies of export performance (Rutto & Ondiek, 2014; Muthamia & Muturi, 2015; Were et al., 2002), the impact of exports on GDP is first expressed in linear form:
GDPₜ = β₀ + β₁EXPORTₜ + εₜ (1)
where β₀ is the intercept, β₁ the coefficient of exports, and εₜ the stochastic error term. Because exports are a component of GDP by national-accounting identity, β₁ is expected to be positive (β₁ > 0). Equation (1) is used in the co-integration stage and in the error-correction specification. To obtain a scale-free elasticity, the long-run relationship is then estimated in double-logarithmic form:
LOG(GDPₜ) = α + β·LOG(EXPORTₜ) + uₜ (2)
where β is the long-run elasticity of GDP with respect to exports. A value of β = 0.878, for example, would imply that a 1% rise in exports is associated with a 0.878% rise in GDP.
2.4 Estimation strategy and diagnostic procedures
Analysis was conducted in E-Views 7. The estimation sequence (Figure 2) follows the standard approach for non-stationary macroeconomic time series (Brook, 2008; Gujarati, 2003).
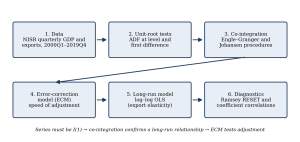
Figure 2. Estimation sequence used in the study.
Correlation. Pearson correlation coefficients were used to gauge the strength of association between exports and GDP (Bluman, 2009). In a bivariate regression with an intercept, the squared correlation equals R², which allows the correlation to be recovered from the long-run model.
Unit-root testing. Before estimating the long-run model, the Augmented Dickey-Fuller (ADF) test (Dickey & Fuller, 1979) was used to check each series for a unit root, since regressing non-stationary series risks spurious results (Granger & Newbold, 1974; Gujarati, 2003). Series found non-stationary at level were differenced until stationary. The ADF test was specified with an intercept and a linear trend, and its decisions were based on the E-Views critical values of −4.08 (1%), −3.47 (5%), and −3.16 (10%).
Co-integration. Where series were integrated of the same order, the Engle-Granger two-step procedure was used to test for co-integration, a long-run equilibrium relationship between non-stationary series whose linear combination is itself stationary (Engle & Granger, 1987). The Johansen (1991) procedure was applied as a cross-check. Under the Engle-Granger approach, the null hypothesis is that the residuals of the levels regression contain a unit root, that is, no co-integration.
Error-correction model. Where co-integration was confirmed, an error-correction specification was estimated to capture the speed of adjustment back to long-run equilibrium. The error-correction term is the one-period lagged residual of the co-integrating regression, RESID(−1), and was expected to carry a negative and statistically significant coefficient between −1 and 0 (Granger & Weiss, 1983; Engle & Granger, 1987).
Specification and multicollinearity diagnostics. Model adequacy was assessed using the Ramsey (1969) RESET test for omitted-variable or functional-form misspecification, and the correlation matrix of the estimated coefficients was inspected, with pairwise correlations above 0.80 considered problematic (Gujarati, 2003). Because the long-run model has a single explanatory variable, multicollinearity among regressors cannot arise by construction. The coefficient correlation is reported for completeness. Table 2 summarises the tests and decision rules.
Table 2. Test battery and decision rules
| Test | Null hypothesis | Reject null when | Purpose |
| ADF | Series has a unit root | t-statistic more negative than critical value | Order of integration |
| Engle-Granger | No co-integration | Residual tau/z significant (p < 0.05) | Long-run relationship |
| Johansen | No co-integrating vector | Trace/max-eigenvalue above critical value | Cross-check |
| ECM term | Coefficient = 0 | p < 0.05, with sign between −1 and 0 | Speed of adjustment |
| Ramsey RESET | Correct specification | p < 0.05 | Functional form |
| Coefficient correlation | — | |r| > 0.80 | Collinearity screen |
Note. Decision rules follow Gujarati (2003) and Brook (2008).
2.5 Reliability, validity, and robustness considerations
Three features of the design support the reliability of the results. First, the data come from a single official statistical source that applies consistent national-accounting definitions across the sample, which limits measurement inconsistency between the two series. Second, the unit-root and co-integration tests guard against the spurious-regression problem that afflicts naive regressions on trending series (Granger & Newbold, 1974). Third, two independent co-integration procedures are used, so the long-run finding does not rest on a single test.
Three features limit validity and are acknowledged in advance. The analysis does not test for structural breaks, although the export series shows sharp turning points around 2008–2009 and 2012–2013 (Section 3.1) that could in principle shift the long-run relationship; this is flagged as a topic for future work. The bivariate design omits other determinants of output. Finally, both series are measured in current US dollars, so nominal price and exchange-rate effects are embedded in the estimates. These issues are returned to in Section 4.5.
3. RESULTS
3.1 Trends in GDP and exports
Over 2000–2019, Rwanda’s GDP followed a consistent upward trend, consistent with steady economic expansion across the study period. Exports followed a more volatile path: a gradual increase from 2000Q1 to 2007Q4, a decline through 2008 to 2009Q1, a sharp rise between 2012Q1 and 2013Q4, and continued fluctuation, with alternating sharp declines and recoveries from 2014Q1 through 2019Q4. This pattern suggests that while Rwanda’s overall output expanded steadily, its export performance has been considerably more sensitive to external and cyclical shocks than output as a whole.
3.2 Unit-root (stationarity) tests
Table 3 reports the ADF results for GDP and exports, at level and after first differencing, and Figure 3 compares the test statistics with the critical values.
Table 3. ADF unit-root test for GDP and exports
| Variable | ADF, level | ADF, first difference | Order of integration |
| GDP | −0.048 (p = 0.9949) | −11.479 (p = 0.0001) | I(1) |
| Export | −2.882 (p = 0.1738) | −11.275 (p = 0.0001) | I(1) |
Note. Critical values: −4.08 (1%), −3.47 (5%), −3.16 (10%).
At level, neither series’ ADF statistic is more negative than the 5% critical value of −3.47, so the null hypothesis of a unit root cannot be rejected for either GDP or exports. After first differencing, both statistics (−11.479 for GDP and −11.275 for exports) are far more negative than even the 1% critical value, with p-values of 0.0001, so the unit-root null is strongly rejected. Both series are therefore integrated of order one, I(1), satisfying the precondition for co-integration analysis.
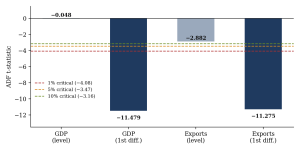
Figure 3. ADF t-statistics at level and first difference against the 1%, 5%, and 10% critical values.
3.3 Co-integration tests
Table 4. Engle-Granger co-integration test (GDP and exports)
| Statistic | Value | Prob. |
| Engle-Granger tau-statistic | −8.884 | 0.0000 |
| Engle-Granger z-statistic | −81.765 | 0.0000 |
Both the tau and z statistics reject the null hypothesis of no co-integration well below the 1% level. The Johansen procedure confirmed the same result, with a co-integrating vector detected at the 1%, 5%, and 10% significance levels. This indicates a long-run equilibrium relationship between exports and GDP over the study period, consistent with the view that Rwanda’s GDP is, in the long run, tied to its export performance.
3.4 Error-correction model
Table 5. Error-correction specification, dependent variable: GDP
| Variable | Coefficient | Std. error | t-statistic | Prob. |
| EXPORT | 7.5588 | 0.2857 | 26.455 | 0.0000 |
| ECM term, RESID(−1) | −0.0049 | 0.1438 | −0.034 | 0.9727 |
| Constant | 181.071 | 37.155 | 4.873 | 0.0000 |
Note. R² = 0.903; adjusted R² = 0.901; F = 355.08 (p = 0.000); Durbin-Watson = 0.803; n = 79 (one observation lost to the lag).
The error-correction term carries the theoretically expected negative sign and is below unity in magnitude, which is consistent with gradual rather than explosive adjustment toward long-run equilibrium after a shock. However, its coefficient is very small (−0.0049) and statistically insignificant (p = 0.973). The estimated speed of short-run adjustment therefore cannot be distinguished from zero and should be treated with caution; this is discussed as a limitation in Section 4.5. The export coefficient is positive and highly significant (p < 0.001), reinforcing the long-run finding that exports are positively associated with GDP. The Durbin-Watson statistic of 0.803 signals positive serial correlation in the residuals, a further reason to interpret the short-run dynamics conservatively.
3.5 Long-run model estimation
Because exports are, by construction, a direct component of GDP, a positive long-run relationship was expected. Table 6 reports the log-log OLS estimation of GDP on exports.
Table 6. Long-run model, dependent variable: LOG(GDP)
| Variable | Coefficient | Std. error | t-statistic | Prob. |
| LOG(EXPORT) | 0.8782 | 0.0298 | 29.477 | 0.0000 |
| Constant | 2.8215 | 0.1300 | 21.699 | 0.0000 |
Note. R² = 0.918; adjusted R² = 0.917; F = 868.89 (p = 0.000); Durbin-Watson = 1.110; n = 80.
The export elasticity of 0.878 implies that a 1% increase in exports is associated with a 0.878% increase in GDP in the long run, an effect that is positive, economically large, and statistically significant well beyond the 1% level. The R² of 0.918 indicates that exports alone account for approximately 92% of the variation in Rwanda’s GDP over the study period. Taking the square root of R² gives an implied correlation of about 0.96 between LOG(GDP) and LOG(EXPORT), which addresses RQ3: the two series are very strongly and positively correlated.
Such a high figure for a single-predictor model is consistent with exports being a direct national-accounting component of GDP. It also means the estimate should not be read as isolating the causal contribution of exports net of other, correlated drivers of growth (investment, government spending, and consumption) that were not included in this bivariate specification. The Durbin-Watson statistic of 1.110 again points to positive serial correlation, so standard errors may be understated; the co-integration result, however, protects the long-run inference against the spurious-regression problem.
To make the magnitude concrete, consider a 10% rise in exports. Under the estimated log-log relationship, GDP would be associated with a rise of about 8.7% (1.10^0.878 − 1 ≈ 0.087). The linear coefficient in Table 5 tells a compatible story in level terms: each additional unit of exports is associated with roughly 7.6 units of GDP, a ratio that largely reflects the size of GDP relative to exports rather than a causal multiplier. Both illustrations describe association along the long-run relationship, not the response of output to an exogenous export shock.
3.6 Model diagnostics
Table 7. Ramsey RESET test for model specification
| Test | Statistic | Prob. | Conclusion |
| Ramsey RESET | F = 2.12 | 0.117 | No evidence of misspecification |
Table 8. Correlation matrix of regression coefficients
| LOG(EXPORT) | Constant | |
| LOG(EXPORT) | 1.0000 | |
| Constant | −0.3118 | 1.0000 |
The RESET p-value (0.117) exceeds the 5% threshold, so the null hypothesis that the model is correctly specified cannot be rejected. The correlation between the coefficient on LOG(EXPORT) and the constant (−0.312) is well below the 0.80 threshold conventionally used to flag multicollinearity (Gujarati, 2003). As noted in Section 2.4, with a single regressors multicollinearity is not a concern by construction, so this check is confirmatory only.
3.7 Summary of hypothesis tests
Table 9. Summary of findings by research question
| Question | Evidence | Finding |
| RQ1: Impact | Co-integration (Engle-Granger, Johansen); LOG(EXPORT) coefficient significant at 1% | Positive and significant; H₀ rejected in favour of H₁ |
| RQ2: Extent | Elasticity = 0.878; R² = 0.918 | A 1% rise in exports is associated with a 0.878% rise in GDP |
| RQ3: Correlation | Implied r ≈ 0.96 from long-run model | Very strong positive correlation |
4. DISCUSSION
4.1 Principal findings
Taken together, the results support H₁ and reject H₀: exports have a positive, statistically significant, and economically substantial association with Rwanda’s economic growth over 2000–2019. Three findings stand out. First, both GDP and exports are I(1), so conventional regression in levels would have been vulnerable to spurious inference. Second, two independent co-integration procedures agree that the series share a long-run equilibrium. Third, the long-run elasticity of 0.878 is large, precisely estimated, and passes the RESET specification check. The principal qualification is that the error-correction term, although correctly signed, is statistically insignificant.
4.2 Comparison with the literature
The findings align with Fatemah and Qayyum (2018) and Aisha et al. (2017), who found exports to be a significant driver of growth in Pakistan, and are broadly consistent with the export-led growth literature reviewed in Section 1.6, including the evidence of Ram (1987) and Krueger (2010) that outward-oriented economies tend to grow faster. They contrast with studies such as Ruba et al. (2014) and Dodaro (1993), which found weak or reverse-direction causality (from growth to exports) in Jordan and in a panel of least-developed countries, and with Sayef and Mohamed (2017), who found no direct long-run relationship in Panama. The contrast is a reminder that the direction and strength of the exports–growth relationship are not universal but depend on each economy’s structure and on the estimation window and technique.
Table 10 places the present findings alongside the principal empirical studies reviewed in this paper, which makes the pattern of agreement and disagreement easier to see.
Table 10. Comparison of the present study with selected empirical studies
| Study | Country, period | Method | Main finding on exports and growth |
| Fatemah & Qayyum (2018) | Pakistan, 1971–2016 | Co-integration, error correction | Exports are a significant long- and short-run driver of growth |
| Aisha et al. (2017) | Pakistan, 1990–2012 | OLS | Positive relationship; stronger effect from growth to exports |
| Sayef & Mohamed (2017) | Panama, 1980–2015 | Johansen, Granger causality | No direct long-run relationship; bidirectional causality |
| Aicha (2005) | Morocco, 1980–2013 | Vector error correction | Co-integration found; no significant short-run causality from exports to growth |
| Ruba et al. (2014) | Jordan, 2000–2012 | Granger causality | Causality runs from growth to exports |
| Dodaro (1993) | Least-developed countries, 1967–1986 | Linear regression | Fragile support for either direction |
| This study | Rwanda, 2000Q1–2019Q4 | ADF, Engle-Granger, Johansen, ECM, OLS | Long-run co-integration; elasticity 0.878; adjustment speed not significant |
Note. Findings as reported by the cited authors; methods and samples differ, so comparisons are indicative.
The present study estimates a long-run association and does not test the direction of causality. The reverse channel, in which faster growth expands productive capacity and therefore exports, cannot be excluded, and the mixed evidence from Jordan and Pakistan suggests it deserves explicit testing in Rwanda.
4.3 Interpretation: accounting identity and economic mechanisms
The confirmed co-integration indicates that this is not a spurious short-run correlation but a persistent long-run equilibrium relationship. It is also reinforced by growth accounting, in which exports, as a component of GDP, relate mechanically to output. That mechanical link inflates the fit of any bivariate model: part of the 92% explained variation reflects the identity itself rather than a behavioural effect. The estimate is therefore best read as an upper-bound indication of the export–output link, not a pure causal multiplier.
Beyond the identity, growth theory points to several channels through which exports may raise output: access to larger markets and economies of scale, foreign-exchange earnings that finance imports of capital and intermediate goods, and productivity gains from competition and learning (Romer, 1990; Lucas, 1988; Krueger, 2010). Rwanda’s import structure, dominated by capital and intermediate goods linked to development projects (BNR, 2020), is consistent with a role for foreign exchange in financing investment. These channels were not tested here; they are hypotheses for the multivariate extensions suggested below.
The agricultural structure of the economy adds a further consideration. With more than half of the working-age population in agriculture (NISR, 2018) and exports still concentrated in traditional commodities such as tea and coffee, export performance is exposed to commodity-price swings and weather. This is consistent with the volatility of exports documented in Section 3.1.
4.4 Policy implications
From a policy perspective, the magnitude of the estimated elasticity suggests that Rwanda’s growth trajectory remains closely tethered to its export performance. This reinforces the rationale behind the National Strategy for Transformation and its emphasis on export promotion as a pillar of the drive toward middle-income status (NST1, 2017–2024). Because exports have historically been more volatile than GDP itself, the close linkage also implies that external shocks to Rwanda’s export markets, whether from commodity-price movements, regional non-tariff barriers, or global demand shocks, are likely to transmit relatively directly into fluctuations in domestic output. Export diversification is therefore valuable as a risk-management strategy and not merely as a growth strategy.
Table 11 links each empirical finding or contextual observation to the policy implication drawn from it and to the corresponding recommendation in Section 5. The linkage keeps the recommendations tied to evidence rather than to general principle alone.
Table 11. From findings to recommendations
| Finding or observation | Implication | Recommendation (Section 5) |
| Long-run elasticity of 0.878; co-integration confirmed | Growth is closely tied to export performance | 1 and 3: promote exports and industrialisation; expand export promotion |
| Exports more volatile than GDP (Section 3.1) | External shocks transmit directly into output | 5: diversify export products and markets |
| Most exports agricultural; over half of workers in agriculture | Productivity of farm exporters drives export capacity | 2: training, credit, inputs, rural-to-market infrastructure |
| Imports growing faster than exports | Persistent trade deficit | 4: strengthen Made in Rwanda to narrow the import–export gap |
Note. Observations drawn from Sections 1.1 and 3.1–3.5.
4.5 Limitations
Four limitations qualify the conclusions. First, the specification is bivariate: exports are the sole explanatory variable for GDP, with no control for investment, government expenditure, consumption, or imports, so omitted-variable bias cannot be ruled out despite the passed RESET test. Second, exports are an accounting component of GDP, so a strong association is partly mechanical, as discussed in Section 4.3. Third, the error-correction term is statistically insignificant (p = 0.973), so the speed of adjustment is not reliably identified. The error-correction specification in Table 5 was also estimated in levels with the lagged residual, rather than in first differences, which is a further reason to treat the short-run dynamics cautiously. Fourth, the Durbin-Watson statistics (0.803 and 1.110) indicate positive serial correlation, implying that reported standard errors may be understated; heteroscedasticity-and autocorrelation-consistent standard errors or a dynamic specification would be a natural robustness check. Finally, the data are in current US dollars, so price and exchange-rate movements are embedded in both series; constant-price series would sharpen the real-growth interpretation.
4.6 Directions for future research
Future research should incorporate additional macroeconomic and socio-economic variables, for example investment, imports, exchange rates, and human capital, in a multivariate vector error-correction framework to isolate the specific contribution of exports to growth. It should also test causality in both directions, use real (constant-price) series, disaggregate exports into traditional, non-traditional, and re-exports, and extend the sample as more recent data become available.
4.7 What the evidence does and does not establish
Table 12 separates the conclusions the data support from those they do not, so that readers can judge how far the findings should inform policy.
Table 12. Strength of evidence
| Claim | Supported? | Basis |
| GDP and exports are non-stationary in levels and stationary in first differences | Yes | ADF tests, Table 3 |
| GDP and exports share a long-run equilibrium | Yes | Engle-Granger and Johansen, Table 4 |
| Long-run elasticity of GDP with respect to exports is positive and large | Yes | β = 0.878, p < 0.001, Table 6 |
| The log-log specification is free of functional-form error | Not rejected | RESET, Table 7 |
| Deviations from equilibrium are corrected at an estimable speed | No | ECM term insignificant, Table 5 |
| Exports cause growth, rather than the reverse | Not tested | No causality test performed |
| The effect holds net of investment, consumption, and imports | Not tested | Bivariate specification |
| The relationship is stable across the sample | Not tested | No structural-break test |
Note. “Not rejected” means the null of correct specification could not be rejected at the 5% level.
4.8 Contribution of the study
The study contributes a country-specific, quarterly, co-integration-based estimate of the export–output relationship for Rwanda over two decades, a design that is more informative than a single-commodity analysis and more current than the long-window study of Nyasulu (2013). It documents transparently both the strength of the long-run result and the weakness of the short-run adjustment estimate, and it sets out a clear agenda for the multivariate and causal work needed to turn a robust association into a policy-grade causal estimate.
5. CONCLUSION
The evidence indicates that exports are a source of economic growth in Rwanda. GDP and exports share a long-run equilibrium relationship, and exports carry a positive, statistically significant, and economically large coefficient (0.878) in the long-run model. The study concludes that exports are positively correlated with, and exert a meaningful influence on, Rwanda’s gross domestic product over the period studied, supporting the export-led growth hypothesis for the Rwandan economy, subject to the limitations noted above.
Declarations. The study used publicly available secondary data and involved no human participants. The author declares no conflict of interest. Data are available from the National Institute of Statistics of Rwanda (NISR).
REFERENCES
Acemoglu, D. (2009). Introduction to modern economic growth. Princeton University Press.
Aicha, E. A. (2005). Causality and co-integration between export, import and economic growth. University Sultan My Slimane, Beni Mellal, Polyvalent Laboratory of Research.
Aisha, N., et al. (2017). The relationship between export and economic growth in Pakistan (1990–2012).
Anwer, M. S., & Sampath, R. K. (2011). Exports and economic growth: What do econometric studies tell us? Pacific Economic Review, 6(1), 147–167.
Awe, A. A. (2013). A dynamic analysis of export and economic growth in Nigeria. Journal of Economics and Sustainable Development, 4(2).
Awokuse, T. O. (2007). Causality between exports, imports, and economic growth: Evidence from transition economies. Economics Letters, 94(3), 389–395.
Bhattacherjee, A. (2012). Social science research: Principles, methods, and practices. University of South Florida.
Bluman, A. G. (2009). Elementary statistics: A step by step approach. McGraw-Hill.
BNR. (2018). Monetary policy and financial stability statement. National Bank of Rwanda.
BNR. (2020). Monetary policy and financial stability statement. National Bank of Rwanda.
Brook, C. (2008). Introductory econometrics for finance. Cambridge University Press.
Bryman, A., & Bell, E. (2007). Business research methods (2nd ed.). Oxford University Press.
Denison, E. F. (2015). The sources of economic growth in the United States and alternatives before us (CED Supplementary Paper No. 13).
Dickey, D. A., & Fuller, W. A. (1979). Distribution of the estimators for autoregressive time series with a unit root. Journal of the American Statistical Association, 74(366), 427–431.
Dodaro, S. (1993). Exports and growth: A reconsideration of causality. The Journal of Developing Areas, 27(2), 227–244.
Domar, E. D. (1946). Capital expansion, rate of growth and employment. Econometrical, 14, 137–147.
Engle, R. F., & Granger, C. W. J. (1987). Co-integration and error correction: Representation, estimation, and testing. Econometrical, 55(2), 251–276.
Faridi, M. Z. (2012). Contribution of agricultural exports to economic growth in Pakistan. Pakistan Journal of Commerce and Social Sciences, 6(1), 13–34.
Fatemah, A., & Qayyum, A. (2018). Modeling the impact of exports on the economic growth of Pakistan. Pakistan Institute of Development Economics.
Gani, A., & Clemes, M. D. (2015). Trade and growth: Evidence from Pacific Island countries. Journal of Economic Studies.
Granger, C. W. J., & Newbold, P. (1974). Spurious regressions in econometrics. Journal of Econometrics, 2(2), 111–120.
Granger, C. W. J., & Weiss, A. A. (1983). Time series analysis of error-correction models. In Studies in econometrics, time series, and multivariate statistics (pp. 255–278). Academic Press.
Gujarati, D. (2003). Basic econometrics (4th ed.). McGraw-Hill.
Harrod, R. F. (1939). An essay in dynamic economics. Economic Journal, 49, 14–33.
Heijdra, B. J., & van der Ploeg, F. (2006). Foundations of modern macroeconomics: Theories of economic growth.
Johansen, S. (1991). Estimation and hypothesis testing of co-integration vectors in Gaussian vector autoregressive models. Econometrical, 59(6), 1551–1580.
Kaldor, N. (1956). Alternative theories of distribution. Review of Economic Studies, 23, 83–100.
Karolina, E., & Södersten, B. (2002). Growth and trade vs. trade and growth. Small Business Economics, 19(2), 147–162.
Kimberly, A. (2009). Economic growth: Its measurement, causes, and effects. University Press.
Krueger, A. O. (2010). Foreign trade regimes and economic development: Liberalization attempts and consequences. Ballinger.
Kumar, M. (2016). The determinants of export performance in developing countries. International trade discussion paper.
Lucas, R. E. (1988). On the mechanics of economic development. Journal of Monetary Economics, 22, 3–42.
Mankiw, N. G. (2009). Macroeconomics. Worth Publishers.
Markusen, J. R., Melvin, J. R., Kaempfer, W. H., & Maskus, K. E. (1995). International trade: Theory and evidence. McGraw-Hill.
Mogoe, S., & Mongale, I. P. (2014). The impact of exports and imports on economic growth in South Africa. Journal of Economics and Behavioural Studies.
Muthamia, D., & Muturi, W. (2015). Factors influencing tea export performance in Kenya.
NISR. (2018). Rwanda labour force survey annual report. National Institute of Statistics of Rwanda.
NISR. (2019). Formal external trade in goods. National Institute of Statistics of Rwanda.
NISR. (2020). Gross domestic product, first quarter 2020. National Institute of Statistics of Rwanda.
NST1. (2017–2024). National Strategy for Transformation. Government of Rwanda.
Nyasulu, T. (2013). Assessing the impact of exports and imports on economic growth: A case study of Rwanda from 1970 to 2010. University of the Western Cape.
OECD. (2009). System of national accounts 2008. United Nations.
Ogbokor, K. (2017). Exports and export diversification in Sub-Saharan Africa: A strategy for post-crisis growth (Africa Growth Initiative Working Paper No. 3).
Olawale Oyebanjo, R. (2017). Export and gross domestic product nexus in Nigeria.
Ram, R. (1987). Exports and economic growth in developing countries: Evidence from time-series and cross-section data. Economic Development and Cultural Change, 36(1), 51–72.
Ramsey, J. B. (1969). Tests for specification errors in classical linear least-squares regression analysis. Journal of the Royal Statistical Society, Series B, 31(2), 350–371.
Romer, P. M. (1990). Endogenous technological change. Journal of Political Economy, 98, S71–S102.
Rostow, W. W. (1990). Theorists of economic growth from David Hume to the present. Oxford University Press.
Ruba, A., et al. (2014). The causal relationship between economic growth and exports in Jordan, 2000–2012.
Rutto, N., & Ondiek, B. A. (2014). Determinants of Kenya’s tea export earnings.
Salvadori, N. (2003). The theory of economic growth: A classic perspective. Edward Elgar Publishing.
Sayef, B., & Mohamed, M. (2017). Impact of exports and imports on economic growth: New evidence from Panama. Journal of Smart Economic Growth, 2(1), 1–13.
Smith, A. (1776/1961). An inquiry into the nature and causes of the wealth of nations (E. Cannan, Ed.). Methuen.
Solow, R. M. (1956). A contribution to the theory of economic growth. Quarterly Journal of Economics, 70, 65–94.
Solow, R. M. (1957). Technical change and the aggregate production function. Review of Economics and Statistics, 39(3), 312–320.
Tjukanov, T. (2011). GDP as a measure of economic welfare.
Uwimana, P., Mugemangango, C., Kipsat, M., Sulo, T., & Nsabimana, S. (2018). An analysis of causality between tea exports and its determinants in Rwanda. East Africa Research Papers in Economics and Finance.
Vanek, J. (1971). Terms of trade and economic growth. Kyklos.
Vijayasri, G. V. (2013). The importance of international trade in the world. International Journal of Marketing, Financial Services & Management Research, 2(9), 111–119.
Were, M., et al. (2002). Determinants of Kenya’s exports.
Yifru, T. (2015). Impact of agricultural exports on economic growth: The case of coffee, oilseed and pulses. Egerton University.
Yuriy, K., & Tadeusz, S. (2014). Essentials of international economics: Questions & answers.